


Data-oriented reporting for black box load testing
The final product of performance tests is the data it generates and how it can be interpreted for decision making. While we focus on generating the proper workload, it is easy to forget that the final product of the test is the report, ultimately answering the question “are we meeting the SLOs?” and, if not – what went wrong? In this article I’ll explain how the expanding test complexity can be embraced in performance test reports, to reduce the troubleshooting time, for data-driven services.
Modern performance tests consist of business scenarios, covering end-to-end workflow – like, in case of an online shop: a customer logging in, browsing products, adding something to shopping cart, placing a new order and logging out. Typical report would look like this:

Each transaction represents a step in end-to-end flow and it’s typically what is required by application owner – there is a service and its aggregated response times, in percentiles. Easy to check against the SLOs, readable and comparable between test runs. Simple, straightforward and presentable to wider audience. Works perfectly for a website that only has a single product to offer and each user buys it only once – but it only answers the first question in the first paragraph- “Are we meeting the SLOs?”
Let’s make things more interesting with the following example:
Top-tier customers (roughly 3% of all customers) are reporting slowness of the service the longer they use the website. The more items they add to cart, the slower the websites become and before they finalize their order, the service times out. Their cart size contains roughly 15 items. Workaround from customer support is to add less items to cart and just place more orders. As it was reported as a performance bug, performance testers included a test case – a separate scenario where a customer orders 15 items, taking 3% of the total traffic. In the next report, the 95th percentile does not change as only 3% of the total calls would be significantly slower.
Now, if the amount of repetitions of the test actions has impact on service response times, it is worth measuring it separately especially if we expect different results calling the same service and this variable becomes a significant factor for reporting and troubleshooting. To make it visible on our charts, we have to take a step back to reporting. Statistics are grouped by the transaction name, so if you hit the same service a few times – the response times would be aggregated for the same service. To make the reports more granular, we can include the variable affecting the response times inside the transaction name. In all performance tools I’ve worked with, the transaction name is resolved at runtime, hence supporting this feature. Here’s how to do it in JMeter:

The report generated becomes more verbose, and it clearly shows the correlation between response times and number of items in cart:

It’s best visible on a chart representing the response times over time:

Please note, in JMeter script, each sampler is encapsulated by a transaction controller with matching name but without the variable.

Each transaction controller has “Generate parent sample” ticked, to generate a separate sample in the report. This sample represents the aggregation of all the service calls, and with a bit of filtering, we can still generate the original report that would land in the final report – keeping the entries in the report to bare minimum, while still being able to troubleshoot data-related problems – based on the same test log file. You can also add a prefix for the samplers you want to keep for business reporting – it makes it easier to create a regex.
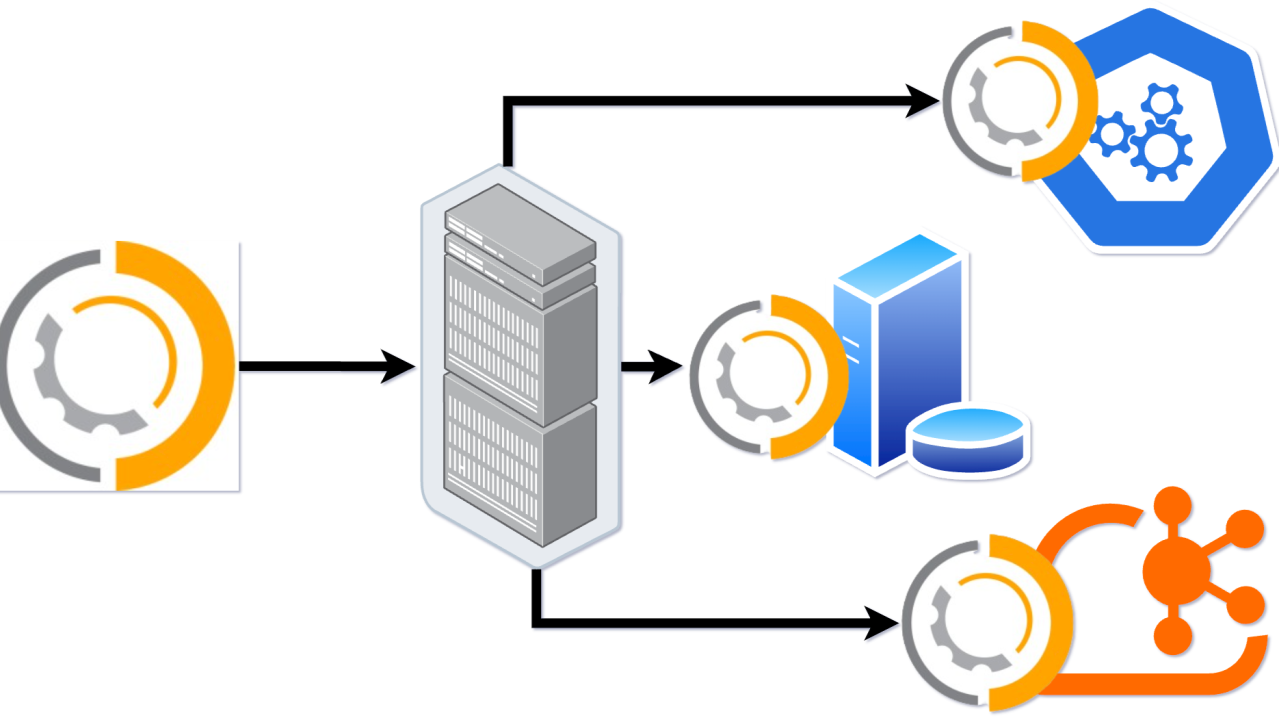
I hope this helps you preparing better tests, and serves as a proof that performance test reports are not limited to response times only. This approach is applicable for any variable of significant correlation to response times. It’s extremely useful for black box testing where we have no access to tested environment and the monitoring capability is limited.
Share this content:


Post Comment